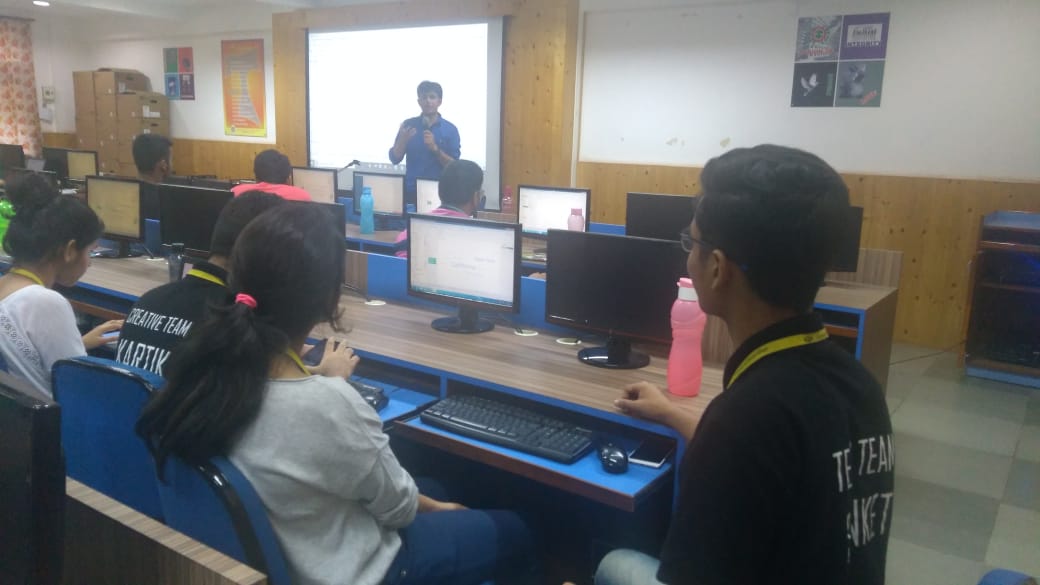
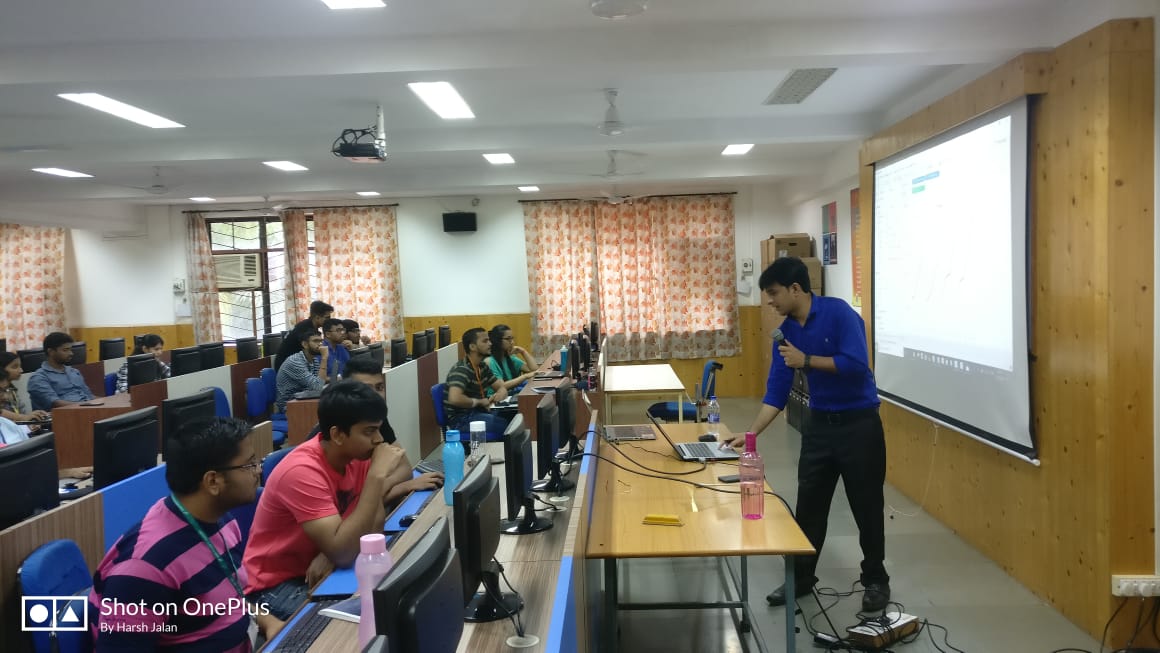
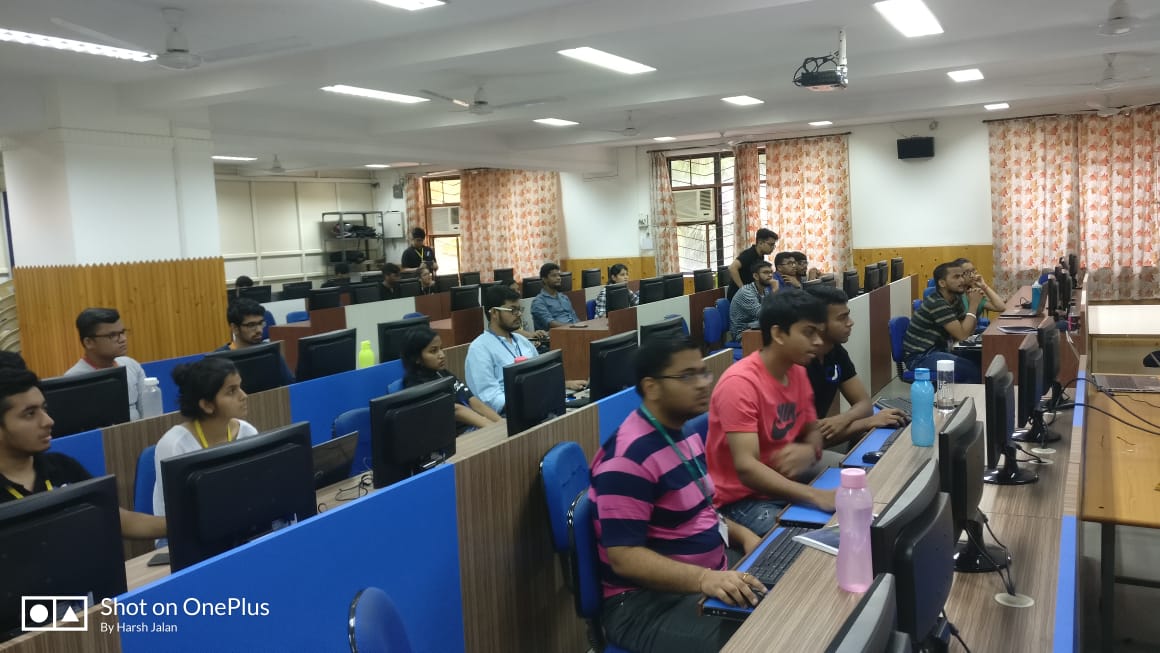
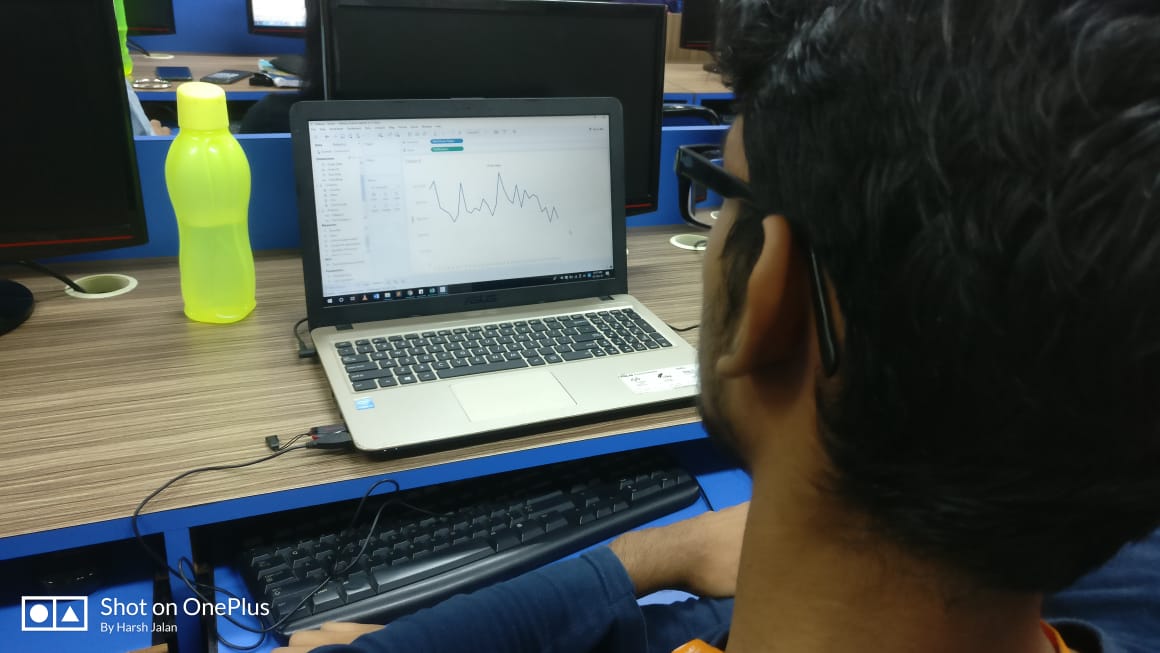
A workshop on ‘Tableau’ was organized by the Computer Society of India - SFIT on 2nd and 7th of October, 2018. Being an extremely powerful data analytics and visualization tool a workshop on the same was able to provide an in-depth look into the world of data sciences. Conducted by Mr.Pawan Lalwani, a frontrunner in Tableau training at industry level, following is a report of the 2-day workshop. About the resource person Mr. Pawan Lalwani is a Freelancer Corporate Trainer for Microsoft Products, Manual Software Testing, Automation Testing, OpenOffice Products, HP Products, and IBM Rational Products. He is the most popular trainer for Tableau on YouTube. Day 1 We started our session at 9:30 am with batch of 21 students not only from college but from other engineering colleges as well. The instructor started off by helping the students get the software on their respective pc. Then he did a briefing of the topics that would be taught on that day. He started by teaching the basic things and introduced the topic and also explained where this software can be used and how useful it is. After reaching the basics and building the foundation he went deeper in the topic and covered other functions like connecting the tableau with database, the difference between the excel and tableau and also told why we prefer tableau over excel, then told in detail about the tools and filters available for the respective tools. After that he introduced the concept of charts and how it can be used for efficient representation of data in data analytics and told about types of charts such as scattered charts, line charts, and then the world maps. Then after 4 hours of working on it students were given a lunch break for 45 minutes. After the break few more concepts were taught like he introduced students now with the concept of maps which he had discussed shortly before break in form of world maps and its layers and did presentation on region wise population on map and highlighting the different data or information in it. Then the charts which he started pre break now he continued with it and covered some more types of charts like bar chart, lollipop chart and pie chart. In the end he taught actions url and actions filter and then finally day 1 of workshop was successfully completed. Day 2 The second day of the workshop had the same strength of participants as Day 1. We started the session same time like Day 1. Trainer requested the students to create another Tableau book to start. Methods to make the previously created book more attractive and more informative were explained by him which was easy enough for the participants to grasp and at the same time impressed them about how well data representations could be bettered. And then after this initial warm up he started day 2 by concept of last type of chart called as funnel chart. After that he started new topic of dashboard. He first gave the introduction of dashboard and then the format of dashboard and taught how to create the dashboard web pages. After these 3.5 hours of session students were given lunch break of 45 minutes. Post break he started with tableau software as a tool for story telling. Then he started with tableau online tool. He first gave introduction of it briefing about how to use it. Then he did carried out various activities involving interaction with tableau online. Then last topic he taught was how to publish reports. And the session ended on a good note by encouraging students to apply on job websites and adding Tableau as their skill which would help them in getting an upper hand in job placements. While commencing the session, we noticed that the participants were pretty much thrilled to have the session and were satisfied. Hence, our tableau workshop ended in a way that benefited a lot of participants.